Loci |
  
|
| Show/Hide Hidden Text |
A mathematical locus is the set of all possible positions of an object that satisfy some specific condition.
A Sketchpad locus is a set of possible positions of an object as a point moves along a path or as a parameter varies over a domain.
The point that moves along a path or the parameter that varies over a domain is called the driver.
The object that actually forms the locus is called the driven object. (The driven object must depend on the driver.)
The path along which the point moves, or the numeric domain within which the parameter varies, is called the domain of the driver.
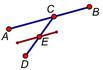
Driver: Point C |
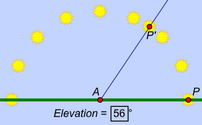
Driver: Parameter Elevation |
The short definition of a Sketchpad locus, then, is this:
A locus is a set of positions of a driven object as a related driver object varies over its domain.
For a general mathematical locus, the number of possible positions is infinite. It would take a long time, and a lot of memory, to create such a locus in Sketchpad, so Sketchpad loci are approximations based on a finite (but potentially very large) set of positions. Each position in this set is called a sample.
There are several kinds of loci, named according to the type of the driven object.
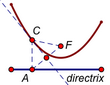
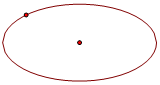
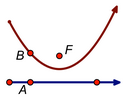
Point Locus: The driven object is a point. In this example, the parabola is the locus of point C as point A moves along the directrix. A point locus is a path object. |
|
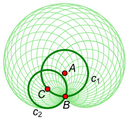
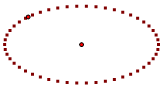
Non-point Locus: The driven object is a geometric object, but not a point. In this example, the shape is the locus of circle c2 as point C moves around circle c1. |
|
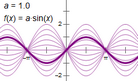
Family of Functions: The driven object is a function plot. This example shows the family of functions f(x) = a sin (x) as parameter a (the driver) varies from -2 to 2. |
|
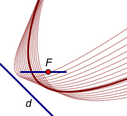
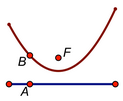
Family of Curves: The driven object is a point locus. This example shows the family of parabolas with the given directrix d as the focus F moves along a segment. |
|
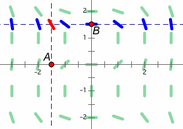
Family of Loci: The driven object is a non-point locus. This example shows the slope field of a differential equation. The red segment is constructed to show the slope at the intersection of the two dashed lines. The blue segments are the locus of this constructed segment as point A moves along the x-axis; they are a segment locus (the locus of the red segment). The green segments are the family of the blue segment locus as point B moves along the y-axis. |
|
See Anatomy of a Locus for more details and examples.
You can change the object properties, label properties, and display attributes of loci.
You can change the line style of continuous loci, and you can change the point style of discrete loci.
Change the opacity of a locus of an interior or a picture using Edit | Properties | Opacity.
Use Edit | Properties | Plot to change the number of samples used to display a locus and to change whether it’s displayed continuously or discretely.
To construct a locus, you must first construct the driven object — the object whose locus you want to construct — in such a way that it depends on the driver. If the driver is a point on a path, the domain of the driver is the path (if it’s of finite length) or a subset of the path (if it’s infinite). If the driver is a parameter, you determine the domain when you create the locus. If the driver is an independent point, you must select a path that doesn’t depend on the driver to serve as the domain for the driver. The driven object can be a point, a straight object, a circle, an arc, an interior, a picture, a function plot, or a locus. 1.Select the driver and the driven object. 2.If the driver is an independent point, select the drive path — a path object that does not depend on the driver. 3.Choose Construct | Locus. |
•Use the Point tool or the Construct | Point on Object command to construct a point on a point locus. Then animate the point along the locus or use the point as the driver point for a new locus. •Use Edit | Merge to merge an independent point to a point locus. Then animate the point along the locus or use the point as the driver point for a new locus. •Use Construct | Intersection to construct the intersection of a point locus with a straight object, a circle, or an arc. |
If a point locus is based on a closed drive path (such as a circle) or a finite path (such as a segment or arc), the domain of the driver is fixed. But if the drive path is infinite and open (such as a ray or line), the domain of the driver—and therefore, the potential size of the locus — is unbounded. If possible, Sketchpad limits the domain based on the portion of the path that is visible on the screen. Such a point locus (on an infinite open domain) displays an arrowhead on the end of the locus. To change the displayed length of such a point locus, use the Arrow tool to drag the arrowhead at either end of the locus. Drag in the direction that the arrowhead points to increase the length of the locus; drag in the opposite direction to decrease the length of the locus. |
Mathematically, a locus may describe an infinite number of positions of the driven object. However, to display an infinite number of positions would require a computer to use an infinite amount of time, so Sketchpad instead displays a large (but not infinite) number of possible positions rather than all possible positions. Each position that Sketchpad does display is called a sample. To change the number of samples for a selected locus: •Press the + or – key. Each press of the key increases or decreases the number of samples. •Choose Increase Resolution or Decrease Resolution from the Context menu. •Choose Edit | Properties | Plot and type a new value for Number of samples. You can also change the initial number of samples for newly constructed point loci. Choose Edit | Advanced Preferences | Sampling and type a new value for Number of samples for new point loci. This setting has no effect on previously constructed loci. |
Change the display of a point locus between continuous and discrete using the Plot Properties for a Locus. To do so, select the locus, choose Edit | Properties, and go to the Plot tab.
|
If a point locus is based on an open domain, Sketchpad displays either a square endpoint or an arrowhead at each end of the locus. An arrowhead can be dragged in either direction to extend or contract the corresponding end of the domain. A square endpoint indicates that the corresponding end of the domain cannot be modified. For instance, if the domain is a segment, the ends of the domain are fixed by the segment endpoints. If the domain is a ray, one end of the domain is fixed by the ray’s initial point, but the other end can be extended or contracted. For a parametric locus, both ends of the domain are always adjustable, either by dragging the arrowheads or by choosing Edit | Properties | Plot. To determine whether arrowheads and endpoints are displayed on a point locus, choose Edit | Properties | Plot and check or uncheck Show arrowheads and endpoints.
|
Subtopic: