Dotted Grid |
  
|
Dotted Grid |
|
This Graph menu command changes the display of the coordinate system between grid lines and grid dots.
Choose Dotted Grid once to change the display to grid dots. Choose it again to change the display back to grid lines.
The position of grid lines or grid dots depend on the scale of the coordinate system. If a coordinate system has a unit distance of 1 cm, the lines or dots appear at every unit (1, 2, 3, ...) If you reduce the scale so that the unit distance is 0.5 cm, they appear at every two units (2, 4, 6, ...). If you increase the scale so the unit distance is 2 cm, they appear at every 0.5 unit (0.5, 1.0, 1.5, ...).
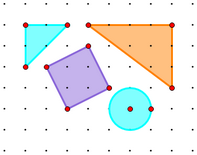
To make points stick to the grid dots:
1.Choose Graph | Snap Points. When point snapping is turned on, independent points snap to integer positions.
2.If necessary, adjust the scale of the coordinate system so that the grid dots also appear at integer positions.
Use this "snappy grid" for geoboard activities and other activities, such as Pick's Theorem, that make use of the grid dots.