Graph Menu |
  
|
Graph Menu |
|
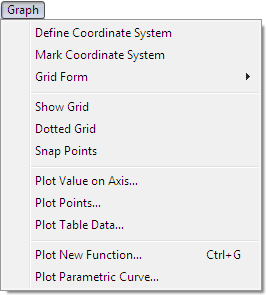
The Graph menu allows you to create and manipulate coordinate systems, to show or hide the grid of a coordinate system, to make points snap to integer coordinates, to plot a single value on an axis or other path, to plot points or table data on a coordinate system, and to construct a function plot or parametric plot on a coordinate system.
This menu offers a variety of commands that serve as a foundation for investigations and activities in analytic geometry and algebra.
Use commands on the Measure menu to measure various quantities on the coordinate plane, including coordinates of points, coordinate distances between points, slopes of straight objects, and equations of lines and circles.
Use commands on the Number menu to create a parameter, calculation, or table, and to define a function symbolically, as a derivative, or graphically.
|
Click the name of any command in the menu to see detailed information about that command.
|