Plot Table Data |
  
|
Plot Table Data |
|
Selection prerequisites: One table
This Graph menu command plots a point on the marked coordinate system for each row of the selected table. If there is no marked coordinate system, Sketchpad creates a default coordinate system.
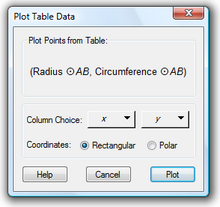
This command displays a dialog box that allows you to choose whether to plot the table data using rectangular or polar coordinates, and to choose which column of the table to plot as the x (or r) coordinate and which column to plot as the y (or θ) coordinate.
Other plotting commands:
Plot Points/Plot as (x, y)/Plot as (r, θ) command