Coordinate Systems and Axes |
  
|
| Show/Hide Hidden Text |
Coordinate Systems and Axes |
|
| Show/Hide Hidden Text |
A coordinate system allows you to measure coordinates, distances, slopes, and equations on the plane and to plot points and functions.
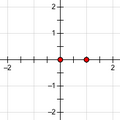
Square
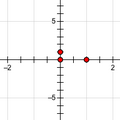
Rectangular
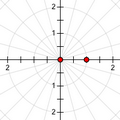
Polar
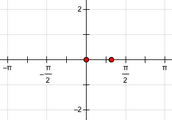
Square with Trigonometric Axis
A coordinate system is defined by its origin, grid form, and the scale of its axes.
Origin: The origin is either a selected point or, if no point is selected when the coordinate system is constructed, a new point in the center of the screen.
Grid Form: Coordinate systems are either square (with the same scale on both axes) or rectangular (with different scales on the horizontal and vertical axes). The grid appears in either rectangular or polar form, and the axes can be measured either in decimal numbers or in multiples and fractions of π.
Scale: The scale of a square coordinate system is determined by a unit point or by a distance measurement in the sketch. The scale of a rectangular coordinate system is determined by two unit points (one for each axis) or by two distance measurements in the sketch.
A coordinate system has a horizontal and a vertical axis. The axes behave as lines for most purposes.
Sketchpad’s analytic measurements (Coordinates, Coordinate Distance, Slope, and Equation) and plotting commands (Plot Value on Axis, Plot Points, Plot as (x, y), Plot Table Data, Plot New Function, and Plot Parametric Curve) are defined in reference to a coordinate system. If your sketch does not yet contain a coordinate system, any of these commands except Plot Value on Axis will create one for you.
You can define more than one coordinate system.
There are two ways to create a coordinate system. •Choose Graph | Define Coordinate System. Depending on the objects you’ve selected, there are several ways this command constructs the coordinate system. •Measure or plot a quantity that requires a coordinate system, such as Coordinates, Coordinate Distance, Slope, Equation, Plot Points, or Plot New Function. If you don’t already have a coordinate system, any of these commands will create one. The default coordinate system is a square system with its origin at the center of your sketch window and a unit point at (1, 0). You can define multiple coordinate systems, though there’s seldom a need to do so. |
•To change the grid form, choose Graph | Grid Form and choose a polar, square, or rectangular grid. On a polar grid, coordinates are measured and points are plotted in polar (r, θ) coordinates; on a square or rectangular grid, coordinates are measured and points are plotted in rectangular (x, y) coordinates. Depending on how the coordinate system was defined, some of the Grid Form commands may not be available. •To change the horizontal axis of a square or rectangular grid between showing decimal numbers and showing multiples and fractions of π, choose Graph | Grid Form | Trigonometric Axis. If your angle units are degrees when you choose Trigonometric Axis, Sketchpad asks whether you want to switch your angle units to radians. You can also change an axis individually by selecting it and choosing Edit | Properties | Axis. •To change both axes of a polar grid between showing decimal numbers and showing multiples and fractions of π, choose Graph | Grid Form | Trigonometric Axis. •To hide or show grid lines, choose Graph | Hide Grid or Graph | Show Grid. •To change the grid to show dot paper rather than grid lines, choose Graph | Dotted Grid. (To use a coordinate system as a geoboard, see How to Construct a Geoboard.) •To change the color of the grid lines, select the grid by clicking a grid intersection and choose a color from the Display | Color submenu. •To change the appearance of tick numbers, select the axis and choose the desired font, size, or style from the Text Palette. •To make points snap to integer coordinate positions when dragged, choose Graph | Snap Points. |
•To change the scale of a coordinate system, drag the unit point. Square coordinate systems have one unit point, and rectangular coordinate systems have two. •To change the scale of a coordinate system, press and drag any axis tick number with the Arrow tool. The scale of a coordinate system may be defined by an object in the sketch; such a coordinate system doesn’t have a unit point and cannot be scaled by dragging axis tick numbers. •If you have more than one coordinate system, make one of them active by choosing Graph | Mark Coordinate System. •To plot a point on the coordinate system, choose Graph | Plot Points. •To plot two measured values on the coordinate system, select them and choose Graph | Plot as (x, y). •To plot a point on an axis, choose Graph | Plot Value on Axis. •To plot a new function on the coordinate system, choose Graph | Plot New Function. •To plot an existing function on the coordinate system, select the function and choose Graph | Plot Function. |
Subtopics: