Use this Properties panel to set the number of samples used to display a function plot or parametric plot, to determine whether the plot is displayed in continuous or discrete form, to determine whether arrowheads and endpoints appear at the ends of the plot, and to set the domain of the plot.
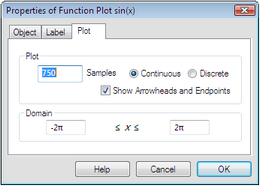
Change this number to determine how many samples that Sketchpad uses to display the function plot. When you increase the number of samples, the function plot appears smoother but takes longer for Sketchpad to draw. As a result, dragging and animating may become slower.
You can also change the number of samples by selecting the function plot and pressing the + or – key.
 Note Note
To change the maximum number of samples allowed, or to change the initial number of samples when you construct a new function plot or parametric plot, choose Edit | Advanced Preferences | Sampling.
|
|
Use this setting to control whether the individual samples are connected (a continuous function plot) or shown as distinct points (a discrete function plot). Below is a sine curve displayed both ways.
The choice between Continuous and Discrete affects only the appearance of the function plot. If you construct a point on a discrete function plot, the constructed point is not restricted to the sample positions, but is free to move smoothly along the plot.
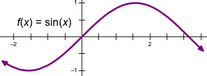
Continuous
|
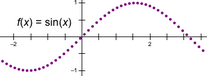
Discrete
|
|
Use this setting to determine whether the function plot shows arrowheads at its ends. If you show the arrowheads, you can drag them to change the domain. Without the arrowheads, this Plot Properties dialog box is the only way to change the domain.
|
When entering limits for the domain, you can use mathematical expressions like 2*3 and π/4. (Press p for π.)
You can also set the domain by dragging the arrowheads that appear at the ends of the function plot.
|


