Other Arrow Actions |
  
|
| Show/Hide Hidden Text |
Other Arrow Actions |
|
| Show/Hide Hidden Text |
In addition to dragging and selecting objects, the Arrow tool has several special actions when used with specific types of objects.
Double-click a point to mark it as the center for rotations and dilations. This has the same effect as selecting the point and choosing Transform | Mark Center. |
Double-click a calculation or function to edit it. This has the same effect as selecting the object and choosing Edit | Edit Calculation or Edit | Edit Function. |
Double-click a parameter to change its value. |
Use the Arrow tool to: •Press and drag a label. •Double-click a label to edit the label with Label Properties. •Double-click a caption to edit the caption. |
In most cases, click the Arrow tool on the intersection of two path objects to construct a point at the intersection. Clicking the Arrow tool at a potential point of intersection has the same effect as clicking the Point tool or using the Construct | Intersection command. So if you want to select an intersection that you haven’t yet constructed, use the Arrow tool to construct and select it in one action. You can also click other construction tools (such as the Straightedge tool, the Compass tool, or the Polygon tool) on an intersection to construct the point of intersection. You cannot construct the intersection of a point locus with another point locus or with a function plot. |
Click the Arrow tool on the body of an action button to perform that button’s action. (Different buttons have different actions: Some may cause an animation to start, others may hide or show objects, and so forth.) When you point at the body of an action button, the cursor turns into a pointing finger indicating you are about to press the button. If you want to select or drag the button rather than perform its action, click the handle of the button rather than its body. If an action button performs an action that takes time to complete, it remains pressed until the action completes. Click the Arrow tool on the body of a pressed button to release it, halting the action in process. |
|
If a coordinate system is constructed based on one or two unit points, you can rescale its axes using the Arrow tool. (You cannot drag to rescale a coordinate system constructed using one or two unit distances, as those distances determine the scale.) There are two ways to rescale an axis of a unit-point-based coordinate system: •Drag any visible number on the horizontal or or vertical axis. (When you position the Arrow tool over such a number, the cursor turns into a bidirectional arrow, indicating you can drag to grow or shrink the scale of that axis.) •Drag the unit point of the horizontal or vertical axis. (If the grid is square, there’s only one unit point, and both axes are scaled together.) Rescaling an axis lets you zoom in or zoom out on the coordinate system. |
|
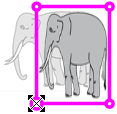
Use the Translate, Rotate, or Dilate Arrow tools to scale, rotate, or dilate a picture that’s not attached to points or that’s attached to a single point. Select the picture and drag one of its resize handles with the appropriate tool. (To maintain the picture’s shape, use the Dilate Arrow tool, or hold Shift while using the Translate Arrow tool.) If the picture is attached to two or three points, resize it by moving the points to which it’s attached. |
|
Function plots, parametric plots, and certain loci can display an arrowhead at one or both endpoints, indicating that the plot or locus extends farther in the indicated direction than is presently displayed. To resize the plot or locus, drag the arrowhead with the Arrow tool. (As you point at the arrowhead, the cursor becomes a multidirectional arrow. Press and drag in the direction in which the arrowhead points to extend the locus or function plot; drag in the opposite direction to contract it.) To show or hide the arrowheads for a plot or locus, choose Edit | Properties | Plot and check or uncheck Show arrowheads and endpoints. You can also change the domain of a plot or a parametric locus numerically in its Plot Properties panel. |
|
To resize a caption, select it and drag the resize handle that appears at the bottom right corner. |
|
To add a row to a table of measured values, double-click the table with the Arrow tool. To remove the most recently added row to a table with more than one row, double-click the table while holding down the Shift key. You can also add or remove rows from a table using the Number | Add Table Data and Number | Remove Table Data commands. |
|